
Price Action Trading: Reading Raw Market Behavior

 Prefer us on Google



Price action trading is an approach to technical analysis that focuses on the movement of price itself, with few or no indicators. Instead of reacting to a signal from a moving average or oscillator, a price action trader reads the "raw" chart — the shape of candles, the levels price respects, and the way momentum shifts — to understand who is in control of the market right now.
The idea behind price action
Every indicator is, ultimately, a calculation derived from price. Because indicators are built from price, they always lag it to some degree. Price action traders argue that if you can learn to read price directly, you get the cleanest and most immediate view of supply and demand. The chart is treated as the record of every decision made by every participant — and that record is the signal.
The core building blocks
Price action is not a single pattern but a way of interpreting several familiar elements together:
- Candlesticks: individual candlestick patterns — such as pin bars, engulfing candles and dojis — describe the battle between buyers and sellers within a single period.
- Support and resistance: the horizontal zones where price has reacted before. Reading how price behaves as it approaches these support and resistance levels is central to the method.
- Market structure: the sequence of higher highs and higher lows (an uptrend) or lower highs and lower lows (a downtrend), and the points where that structure breaks.
- Chart patterns: larger formations — triangles, ranges and flags — that emerge from the interaction of these elements. See classic chart patterns for the most common shapes.
How traders apply it
A typical price action workflow starts with the bigger picture — the trend and the key levels on a higher timeframe — and then drops to a lower timeframe to time a decision. Rather than "buy when the indicator crosses," the logic is closer to "price is pulling back into a level that held before, and the candles show sellers losing momentum, so this is where a decision becomes reasonable." Because the setups are defined by clear levels, they come with natural points of invalidation for managing risk.
Advantages and limitations
The appeal of price action is clarity: fewer tools, less lag, and a framework that adapts to any market or timeframe. The trade-off is that it is subjective. Two traders can read the same chart differently, and screen time is needed to develop consistency. Price action is best understood as a skill that complements indicators rather than a magic replacement for them — many traders blend the two.
Price action and futures
Price action reading applies equally to spot and futures markets. Crypto futures traders lean on it heavily because it works in both directions — the same skills that identify a potential move up also identify a potential move down. On WEEX, mapping structure and levels onto a futures chart helps a trader define exactly where a setup is proven wrong, which is essential when using leverage: the tighter your invalidation, the more precisely you can size and control risk. Leverage magnifies losses as well as gains, so disciplined risk management is non-negotiable.
Timeframes and confluence
Price action gains reliability when signals line up across timeframes. A level that appears on the daily chart carries more weight than one visible only on a five-minute chart, and a candlestick signal means more when it forms exactly at a level that has held before. Many traders adopt a simple rule of thumb: let the higher timeframe define the direction and the important levels, then use the lower timeframe only to fine-tune the moment of entry. This top-down habit filters out a great deal of noise and keeps decisions anchored to the bigger picture.
Key takeaways
- Price action reads the market from raw price rather than lagging indicators.
- Its building blocks are candlesticks, support and resistance, market structure and chart patterns.
- Setups come with clear invalidation points, which supports disciplined risk control.
- It is powerful but subjective — screen time and practice matter, and it pairs well with other tools.
Build on this with support and resistance, candlestick patterns, and the wider set of chart patterns.
This article is for educational and informational purposes only and does not constitute investment, financial, or trading advice. Cryptocurrency trading — especially futures trading with leverage — carries a high level of risk. Always do your own research before making any decisions.
Disclaimer: This content is provided for general branding and informational purposes only and doesn't constitute financial, investment, legal, or tax advice. Any events, rewards, online events, or related information mentioned herein should not be considered a recommendation, solicitation, or invitation to purchase, sell, trade, or otherwise deal in any crypto assets or to use any services. Crypto assets are highly volatile and may result in loss. WEEX services and online events may not be available in all regions and are subject to applicable laws, regulations, and eligibility requirements. You are responsible for ensuring that your use of WEEX services complies with local laws and for carefully assessing the risks before participating in any crypto-related activities.
You may also like

Gold Price Outlook 2026: Third-Party Analyst Scenarios (Maintained, Educational)

Silver Price Outlook 2026: Third-Party Analyst Scenarios (Maintained, Educational)
How to Buy Bitcoin in Brazil: A Step by Step Guide for Beginners

Dolar Crypto in Argentina: How to Use Stablecoins for Dollar Exposure and Buy Bitcoin
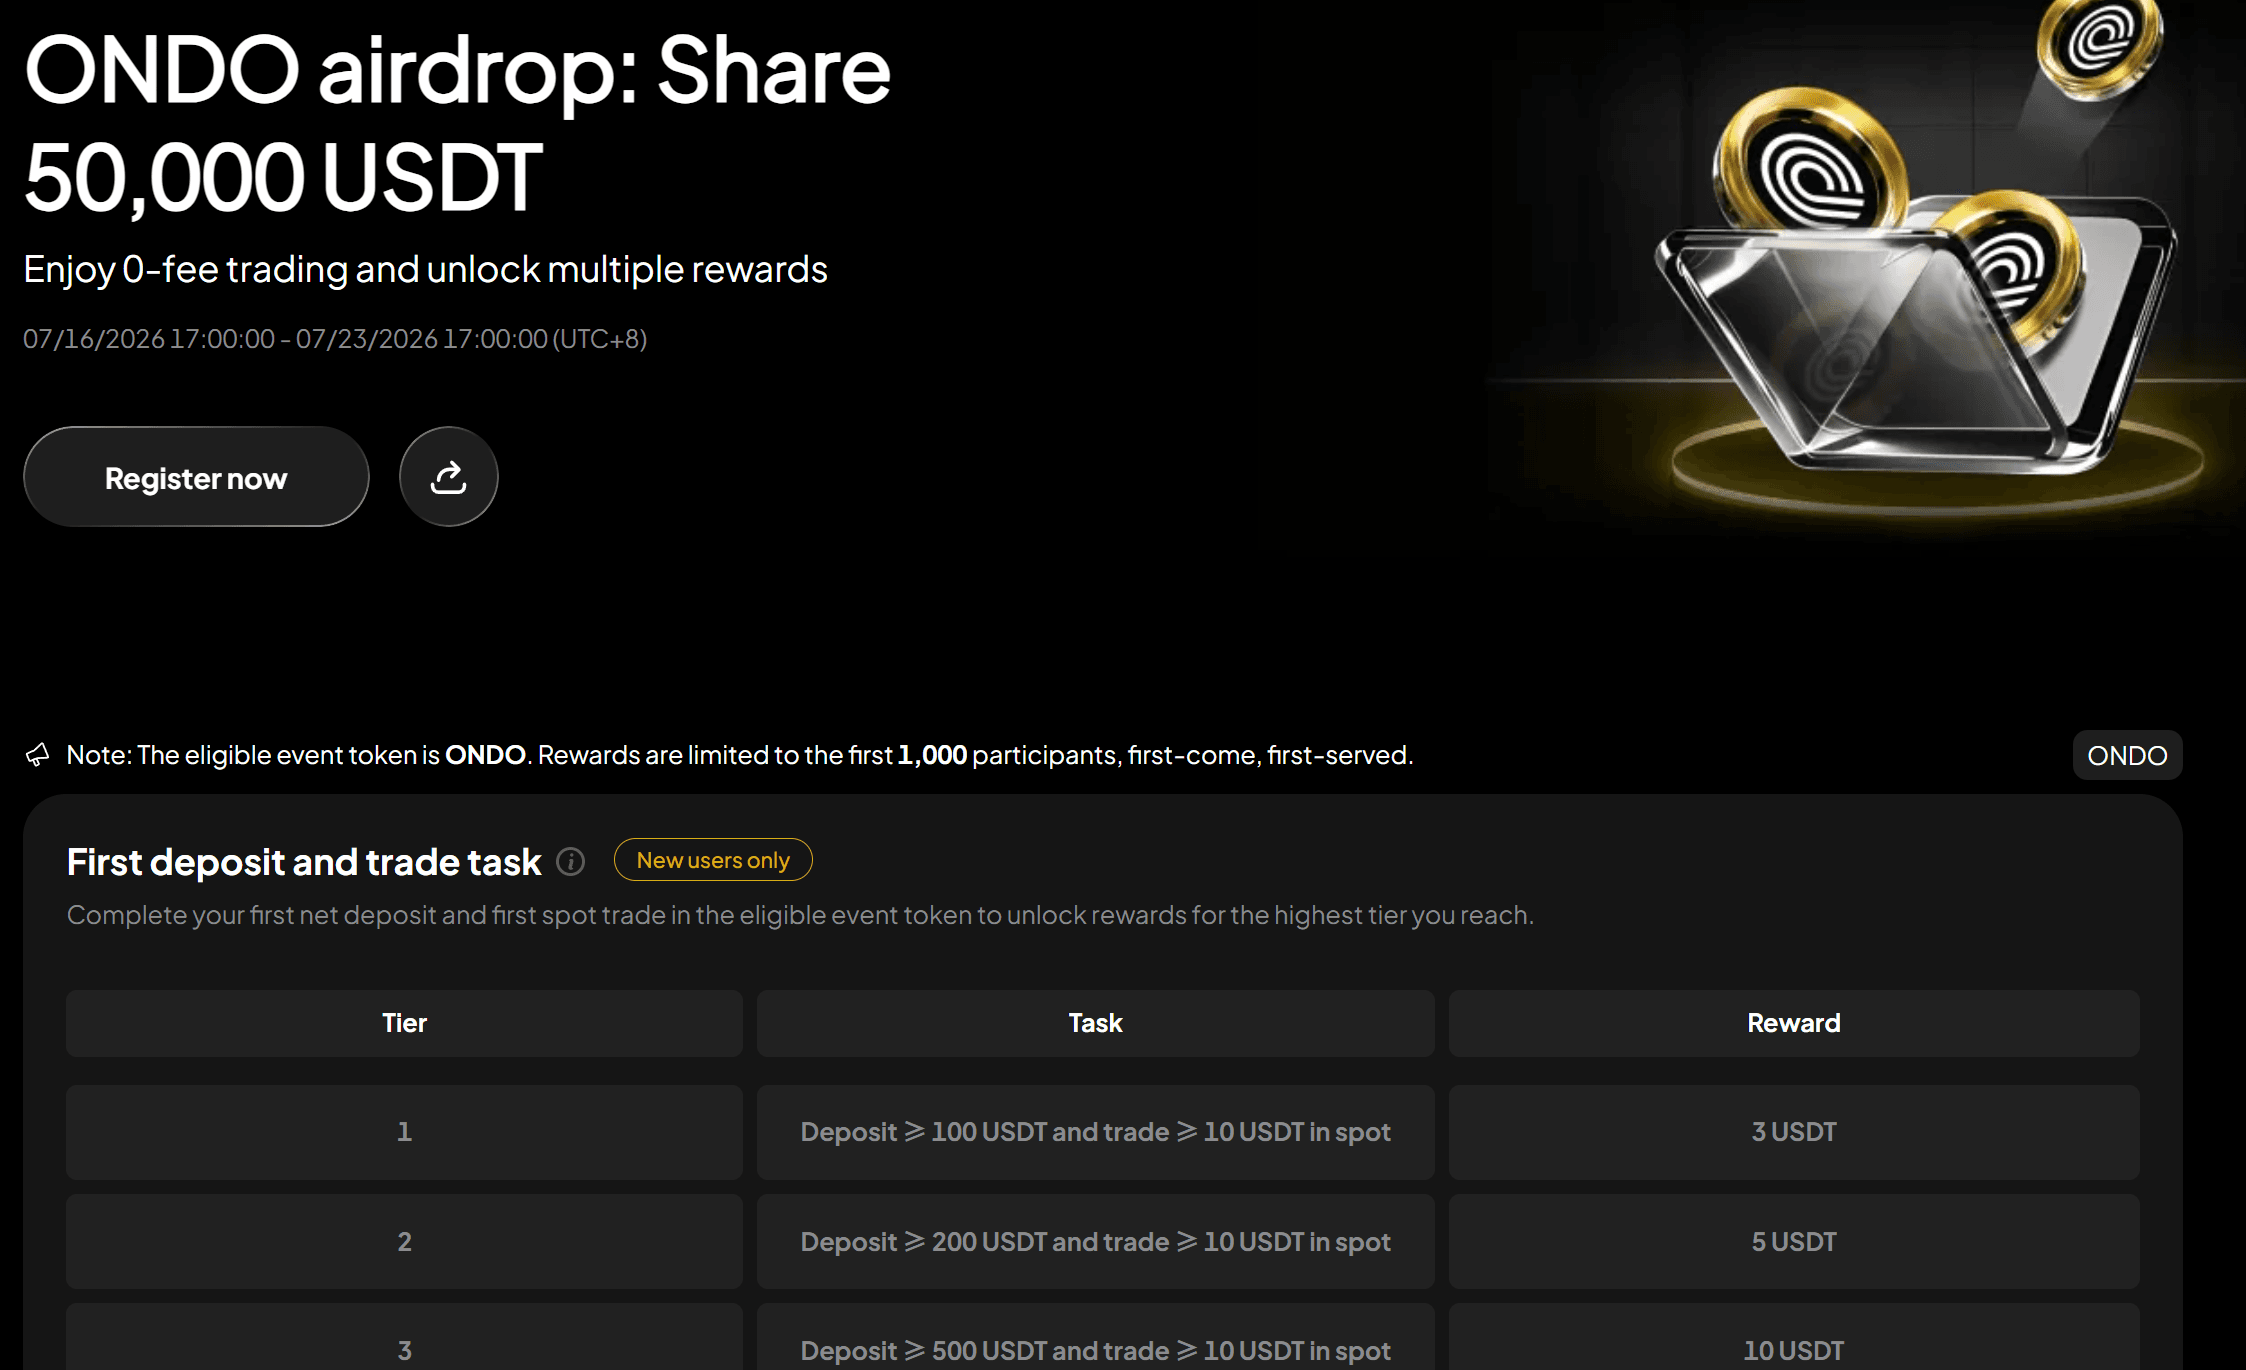
Claim ONDO Airdrop Rewards: Complete Tasks and Share 50,000 USDT
Claim ONDO Airdrop rewards on WEEX and share 50,000 USDT. Learn how to join, complete trading tasks, earn bonuses, and trade ONDO/USDT during the event.

Japan's Crypto Regulation Basics: The FSA, JVCEA, and User Protections

How Overseas Crypto Exchanges Work for Japan Residents (and the Risks)
Modelo 721 Explained: Declaring Foreign Crypto Holdings in Spain

DEX vs CEX for Perpetuals: Trading Perps On-Chain vs on an Exchange

What Is an On-Chain Order Book? How Order-Book DEXs Work
What Is a Perp DEX? Perpetual Futures on Decentralized Exchanges
Italy Crypto Tax 2026: The Capital Gains Rate Rises to 33%
Support and Resistance: How to Identify Key Levels on the Chart

Supply and Demand Zones: A Smart-Money Trading Guide

Head and Shoulders Pattern: How to Spot and Trade It

Classic Chart Patterns: Triangles, Double Tops/Bottoms and Flags
Airdrop Farming: How to Farm Crypto Airdrops the Right Way
What Is a Moving Average (MA)? Types and How to Read Them
What Is Elliott Wave Theory? A Beginner's Guide to Counting Waves
What Is Fibonacci Retracement? How to Draw and Use It
What Is the Ichimoku Cloud? A Beginner's Guide to Reading It
What Is the VIX (Fear Index)? How to Read It and Its Link to Crypto
What Is Dow Theory? The Six Principles Explained
What Is a Death Cross? Understanding the Bearish Signal
What Is a Golden Cross? A Beginner's Guide to the Bullish Signal
MiCA Regulation: What Changes for Polish Crypto Investors
Open Interest: What It Means in Futures Trading
Call vs Put Options: What They Are and How They Differ
What Are Sakata's Five Methods? Classic Candlestick Patterns Explained
What Is the FOMC? Meeting Schedule and Why Crypto Reacts
Gold Price Outlook 2026: Third-Party Analyst Scenarios (Maintained, Educational)
Silver Price Outlook 2026: Third-Party Analyst Scenarios (Maintained, Educational)
How to Buy Bitcoin in Brazil: A Step by Step Guide for Beginners
Dolar Crypto in Argentina: How to Use Stablecoins for Dollar Exposure and Buy Bitcoin
Claim ONDO Airdrop Rewards: Complete Tasks and Share 50,000 USDT
Claim ONDO Airdrop rewards on WEEX and share 50,000 USDT. Learn how to join, complete trading tasks, earn bonuses, and trade ONDO/USDT during the event.
Japan's Crypto Regulation Basics: The FSA, JVCEA, and User Protections


