The market volatility continues. How to determine when the pullback is over?

Original Author: Murphy, On-chain Data Analyst
How to Determine if a Pullback is About to End?
There are many methods to determine if a short-term pullback is about to end. As mentioned before, analysis can be conducted from different perspectives such as chip structure, financial pressure, sentiment feedback, etc. Today, I will share another method that I often use and find very effective, which is to observe the cost basis changes of different time cohorts as a reference point.
Before discussing the logic, let's first look at a case study—the bottom judgment of a large cycle
In Figure 1 below, the blue line represents Long-Term Holder's Average Cost Basis (LTH-RPC), the red line represents Short-Term Holder's Average Cost Basis (STH-RPC), and the black line is BTC's price.
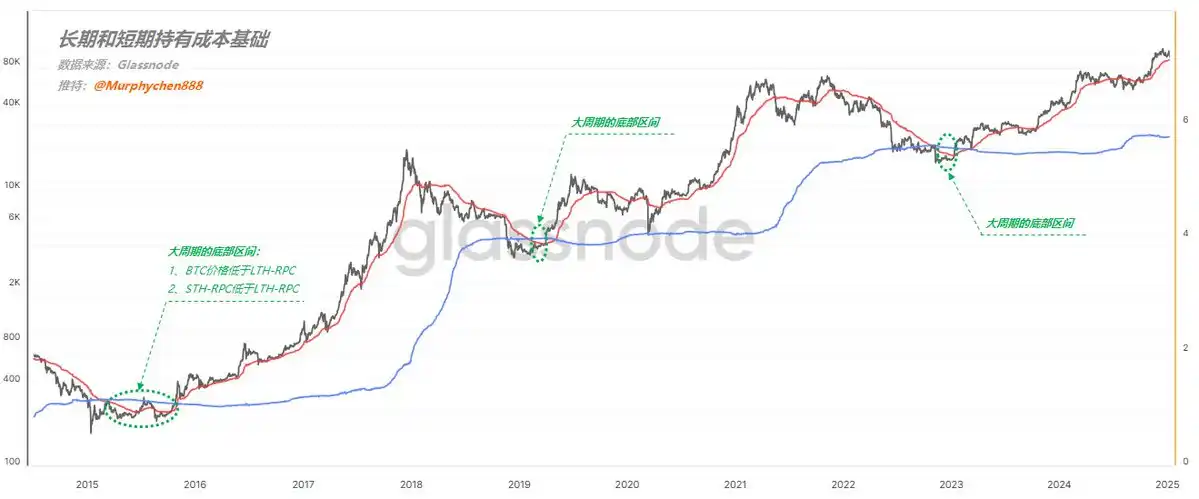
(Figure 1)
Pay attention to the area I have circled in green with a dotted line. As long as the following 2 conditions are met simultaneously:
- Condition 1, BTC price is below LTH-RPC
- Condition 2, STH-RPC is below LTH-RPC
This stage is the bottom range of the large cycle and is also an excellent opportunity to buy the dip!
The underlying logic is as follows:
First, when the BTC price falls below the LTH-RPC, it means that the average cost of long-term holders is at a loss. This indicates that the price is severely undervalued, and the market bubble has almost completely burst.
Second, in the vast majority of time, the longer the chip holding period, the lower the relative cost. Therefore, it is extremely rare for STH-RPC to be lower than LTH-RPC.
It indicates that during the price decline, there were a large number of loss-exiting short-term holders, but new short-term holders entered to buy the dip. After frequent turnover, the cost of short-term chips was actually pulled below the cost of long-term chips. This is a phase of oversold prices, signaling the bottom of the panic sentiment. Following the logic above, we can also apply the same reasoning to determine the duration of a bull market pullback.
Figure 2 below lists the cost bases for: 1d-1w (red line), 1w-1m (yellow line), 1m-3m (blue line), 3m-6m (purple line)

(Figure 2)
First, let's look at February to May 24th, which happens to be the process from the start of a trend to decay and a pullback. The entire process is accompanied by the widening and narrowing of the distance between the blue line and the red line (as indicated by the green arrows in the image);
Eventually, the blue line ran to the top, while the red line was at the bottom, meaning that the relative short-term cost of chips was lower than the relative long-term cost of chips. I call this phenomenon the "reverse arrangement structure" of long-term and short-term costs.
I marked three points in the image with orange dashed lines, all of which show the formation of a blue, yellow, red arrangement from top to bottom, or a purple, blue, yellow, red arrangement, representing the relative bottoms during pullbacks.
So, the current trend is also transitioning from rapid expansion to gradual contraction, but the blue line is still below. If we are to see a market restart in the short term, perhaps a "reverse arrangement structure" needs to be formed first. However, after this period of turnover, the blue line is already very close to the red and yellow 2 lines. As long as there is another period of consolidation, the structure can form, thereby meeting the conditions for forming a relative bottom.
PS: Of course, it would be best to form a purple, blue, yellow, red "reverse arrangement structure," but this would require a longer turnover time (at least 4-5 months).
Summary:
Based on the change in the cost base of different time groups as the basis for judging the time of a pullback, the higher the relative cost of long-term chips, the closer we are to the bottom once a blue, yellow, red "reverse arrangement structure" is formed from top to bottom. This indicates that turnover is sufficient, sentiment is close to the bottom, and the pullback time is coming to an end.
The content shared in this article is for communication and research purposes only and should not be construed as investment advice.
You may also like

Morning Report | OpenAI has submitted an S-1 registration statement draft to the U.S. SEC; Morpho completes $175 million financing

Morning Report | BitMine increased its holdings by 126,971 ETH last week; trader Eugene announced his exit from the crypto market

Wang Chuan: How can one not feel anxious after the neighbor Old Wang made thirty times profit by investing in storage stocks? (Seven) - A quarter-century cycle

Cryptocurrency CEXs are flocking to sell US stocks, and traditional brokerages are facing an "uninvited guest."

$75 billion in foreign capital has fled, and South Korean retail investors have absorbed it all using leverage

Japan’s Three Megabanks Plan Joint Stablecoin Issuance in Fiscal 2026
MUFG, SMBC, and Mizuho reportedly plan to jointly issue fiat-pegged stablecoins in fiscal 2026, signaling Japan’s growing push into bank-led digital payment infrastructure.

Humanity Discloses H Token Dual-Chain Attack Details, With Losses on Ethereum and BSC Exceeding $36 Million
Humanity said the H token attack across Ethereum and BSC caused more than $36 million in losses after leaked ProxyAdmin keys enabled malicious contract upgrades and token minting.
White House Discusses CLARITY Act With Law Enforcement Ahead of Senate Vote
The White House discussed the CLARITY Act with law enforcement ahead of a Senate vote, focusing on illicit finance risks and developer protections.

Bitcoin Trading Guide 2026: Strategies for Experienced Traders

What Is XAUT and PAXG? Why Tokenized Gold Is Booming in 2026

Will the SpaceX IPO Hurt Bitcoin? Here's What Traders Are Watching

Foreign selling in the South Korean stock market accelerates, with cumulative net sales reportedly reaching $75 billion this year
On June 9, The Kobeissi Letter, citing Goldman Sachs data, reported that global investors are selling South Korean stocks at an unusually rapid pace. In the latest trading session, foreign investors sold about $801 million worth of Kospi constituent stocks again; total foreign outflows last week reached about $10 billion, and the market has been in net foreign selling on nearly every trading day over the past month. According to the data cited in the report, foreign investors have sold about $75 billion worth of South Korean stocks so far this year. Meanwhile, South Korean retail and institutional investors together recorded roughly $69 billion in net buying over the same period, suggesting that the market’s main buying support has come from domestic capital rather than returning overseas funds. The information currently disclosed still mainly comes from The Kobeissi Letter’s retelling and Goldman Sachs data summaries, while public details on the statistical period and the specific definition of “selling” remain relatively limited.

Fortune Warns of Strategy’s Financing Structure Risks as Bitcoin Premium Narrows
Fortune warned that Strategy’s Bitcoin treasury model faces growing financing risks as MSTR’s net asset premium narrows and preferred stock dividend pressure increases.

Ferrari Challenge Le Mans: Carl Moon to Dominate in WEEX Livery

Sahara AI Responds to SAHARA’s Sharp Drop: No Contract or Product Security Issues Found, Internal Investigation Underway
Sahara AI responded to SAHARA’s 60% price drop, saying no token contract or product security issues have been found and an internal investigation is underway.

WEEX Deposit/Withdrawal Dynamic Island: Your Asset Status, Always in Sight
Scaling Crypto Derivatives: The Digital Asset Infrastructure Behind High-Volume Trading
In the fast-moving digital asset ecosystem, derivatives platforms face an extreme architectural test. High-leverage futures markets demand more than just standard security—they require absolute operational precision, zero-latency matching engines, and ironclad structural scalability, all while navigating intense market volatility.
As global platforms scale to meet these demands, the industry is shifting away from rigid, monolithic setups toward a more agile, "decoupled" infrastructure philosophy.
The Blueprint for High-Volume Copy TradingFor elite global exchanges like WEEX (founded in 2018), this architectural choice becomes critical when scaling high-volume retail features like social copy trading. When thousands of users automatically mirror the real-time strategies of elite traders simultaneously, it triggers sudden, monumental spikes in concurrent transactional volume.
To prevent execution latency or settlement bottlenecks during these peak volatility events, a platform's primary engine must remain entirely dedicated to risk management, copy-trade synchronization, and order matching.
The Architectural Rule: New-generation platforms must separate front-end user execution engines from heavy backend infrastructural overhead to eliminate operational friction.
By separating these layers, platforms can maintain complete sovereignty over their trading environments and user experiences while strategically aligning with institutional-grade infrastructure ecosystems. This strategic framework allows modern exchanges to leverage advanced Digital Asset Custody infrastructure such as Cobo’s behind the scenes, ensuring that backend wallet management scales elastically alongside trading spikes.
Capitalizing on Market Momentum and 400× LeverageIn a derivatives arena where platforms offer up to 400× leverage on perpetual contracts, capital efficiency and market agility are core business metrics. To capture market momentum, an exchange needs the ability to rapidly expand its asset offerings, supporting everything from legacy crypto assets to sudden, trending altcoins across a massive library of trading pairs.
Adopting a flexible, scalable Wallet-as-a-Service (WaaS) solution such as Cobo’s could completely rewrite the development timeline for high-growth exchanges. Instead of spending months of engineering capital building out custom backend wallet architectures for every new blockchain network, platforms can deploy localized infrastructure in days.
This agility allows platforms to instantly scale their listings to over a thousand trading pairs without compromising security or delaying time-to-market. It mirrors the exact operational advantages seen during high-velocity market events, similar to how advanced wallet infrastructure empowers platforms during sudden asset surges; allowing exchanges to pass that speed and liquidity directly to their global user base.
A Mature Foundation for GrowthThe synergy between trusted infrastructure ecosystems and global trading platforms represents the natural evolution of a maturing crypto market. As WEEX continues to scale its global spot and derivatives offerings for over 6 million users, adopting robust backend paradigms proves that platforms no longer have to compromise between cutting-edge trading velocity and uncompromised structural security.

Get Paid to Onboard? Try WEEX’s New Homepage with Rewards for Registration, Deposit & Trade
Morning Report | OpenAI has submitted an S-1 registration statement draft to the U.S. SEC; Morpho completes $175 million financing
Morning Report | BitMine increased its holdings by 126,971 ETH last week; trader Eugene announced his exit from the crypto market
Wang Chuan: How can one not feel anxious after the neighbor Old Wang made thirty times profit by investing in storage stocks? (Seven) - A quarter-century cycle
Cryptocurrency CEXs are flocking to sell US stocks, and traditional brokerages are facing an "uninvited guest."
$75 billion in foreign capital has fled, and South Korean retail investors have absorbed it all using leverage
Japan’s Three Megabanks Plan Joint Stablecoin Issuance in Fiscal 2026
MUFG, SMBC, and Mizuho reportedly plan to jointly issue fiat-pegged stablecoins in fiscal 2026, signaling Japan’s growing push into bank-led digital payment infrastructure.
